In this article we are going to create a playbook that list the suspicious connection sources and filters them into a top ten list.. This tutorial will reinforce the playbook setup and go into detail on filtering and grouping data in a playbook. Let’s get started!
Table of Contents
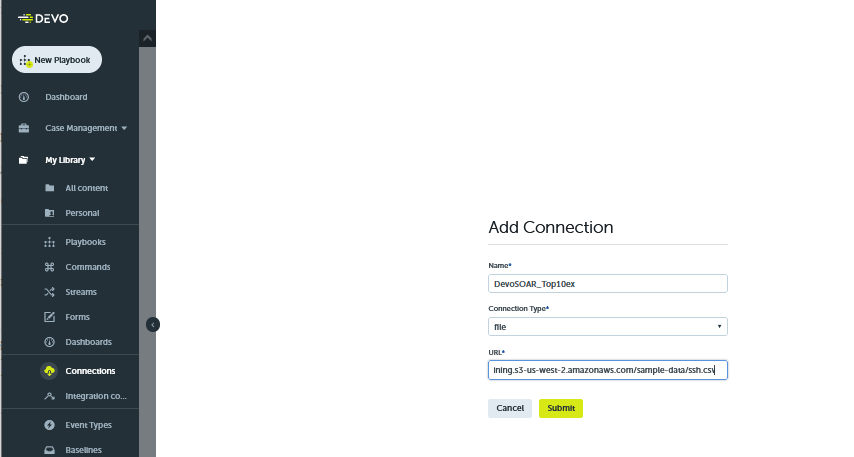
Create a Connection

The first step in creating this playbook is to import the data. In this example, the data stored in a CSV file accessible via the following URL.
| Task | Value |
|---|---|
| Name | DevoSOAR_Top10ex |
| Connection Type | file |
| URL | https://logichub-training.s3-us-west-2.amazonaws.com/sample-data/ssh.csv |
This first step is called a Connection, aptly named as it creates a connection to a data source.
After you submit the new connection you will be sent to the connections page. This will list all your existing connections. You can also search for your new connection on the top right. Do this now to verify that your connection is set to active.
Create event type
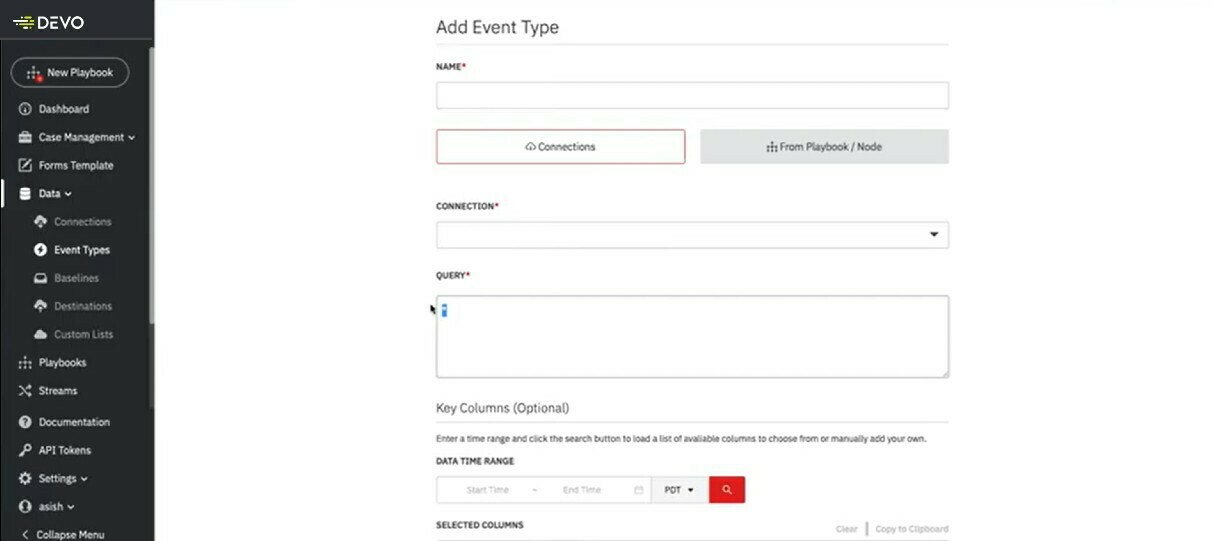
Now that a connection to the data has been made, we need to create an event type to bring the data into our playbook.
Enter these values:
| Task | Value |
|---|---|
| Name | Top10Ex1_Data |
| Connection | DevoSOAR_Top10ex |
| Query | * |
There are additional values in this window but these are the only values we need for this tutorial. These are the only values we need to reach the next step.
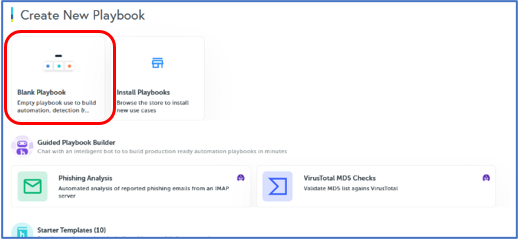
Start a Blank Playbook
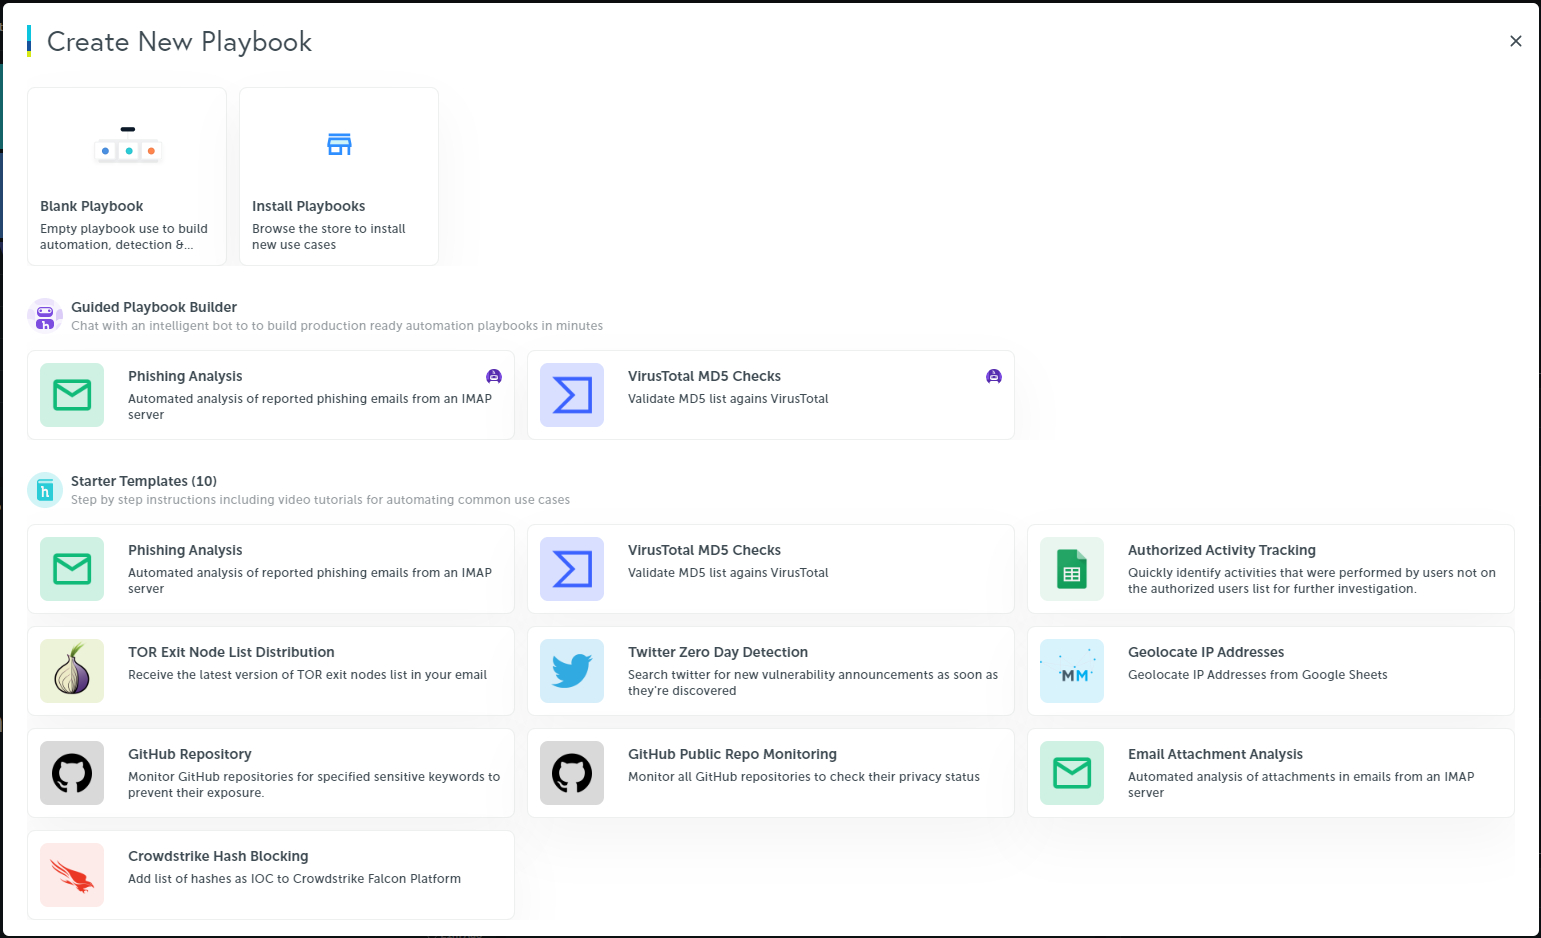
Now the fun part begins! Let's start working with a new playbook. Click on New Playbook button on the left navigation pane to get started.
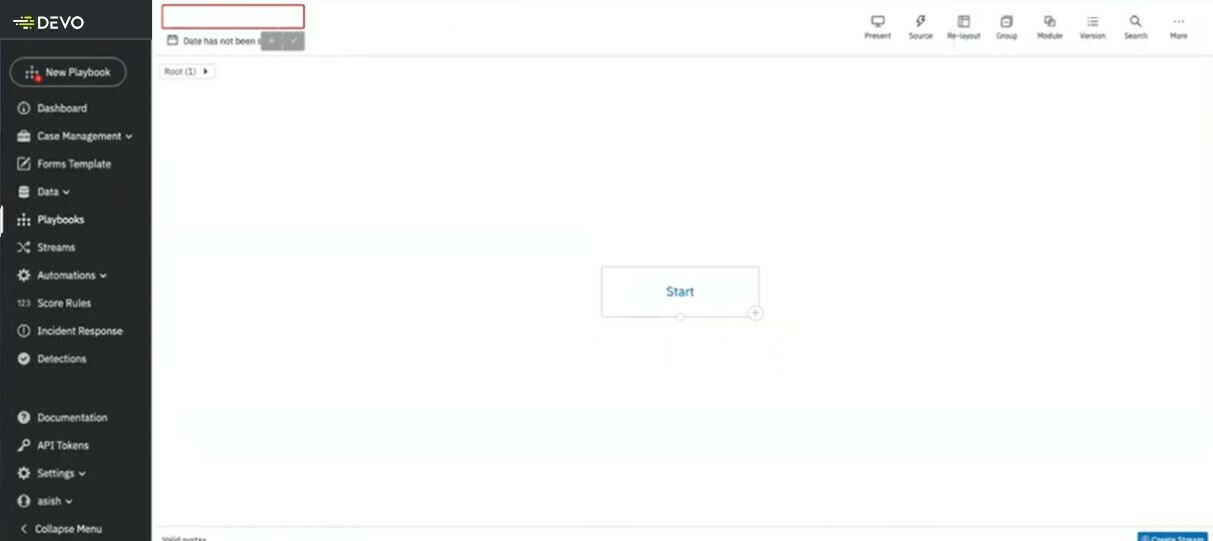
-
Let’s give the Playbook a new name, on the top left you can change the name to “Learning2Play” or a name of your choice.
-
Set the Time Period: As our data is coming from a file, you can set this to any time period. Use one of the presets available at the bottom of the calendar, like “Last 15 Minutes”
-
Click Save.
On the right hand side you will see the main command buttons:

Remember you can move all the modules about freely as you think through your playbook. You can use Re-layout to automatically bring them all back and center then on the page.
Let’s bring in the data we set up earlier by adding a Source Module. Click on the lightning bolt.
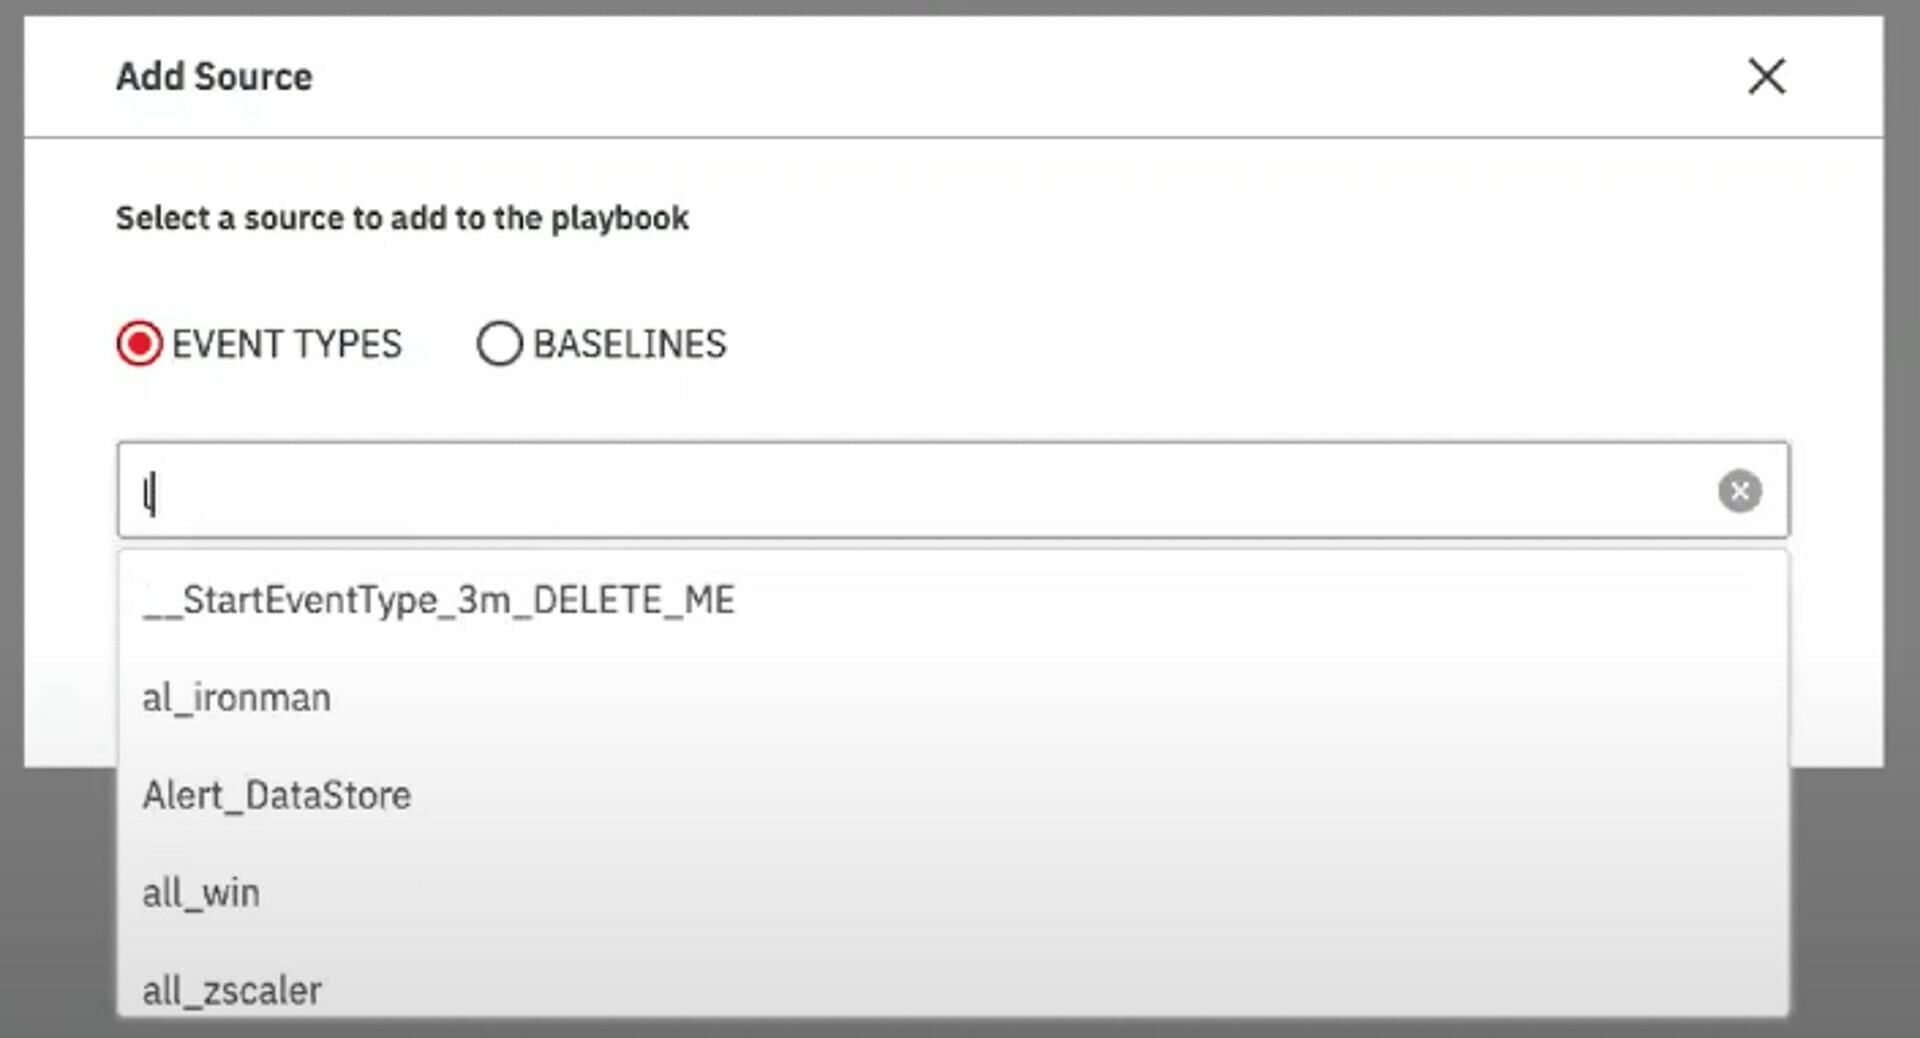
Start typing the name of our event type for this exercise. In this example, I have named it “Top10Ex1_Data”. Autocomplete will populate the name as you type.
Source Module
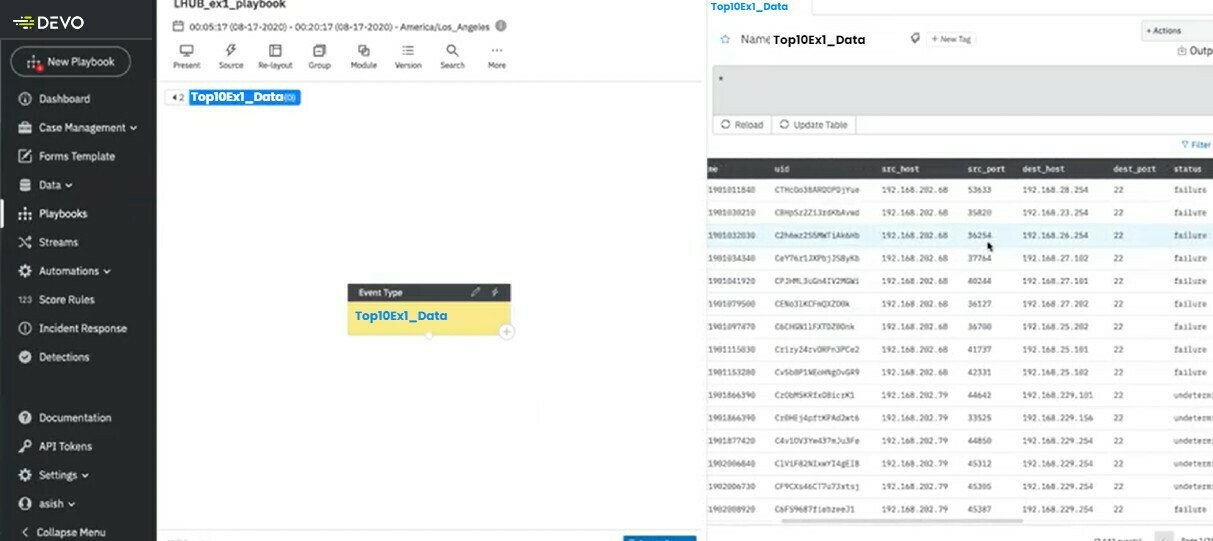
The source module will appear in the center of your work area. Click on it to open the detail panel on the right. Here you will find the query in use, as well as the data output.
Add Computation Node
Click on the plus sign on the bottom right of the Source Module to add a computation node so we can filter the data. + → Add Node → Computation
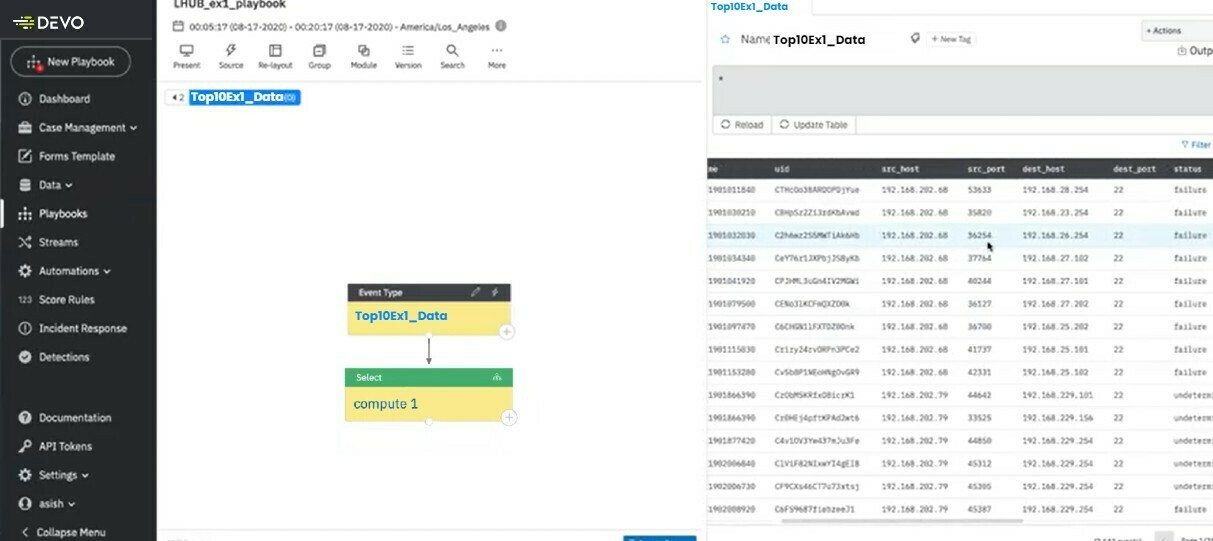
Rename it compute1 and click on it to open the details page on the right. Here we will start filtering our data.
Filtering Data
Query language is based on Spark SQL and can use any Spark SQL functions listed on the Apache Spark website as well as some unique operator. To add any SQL queries just enclose it in backtick (‘) marks.
In the query window on the right hand side type in:
'select src_host, sr_port, status from Top10Ex1_Data'Click on update table to see the results:
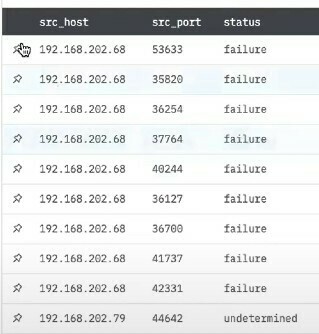
Great job!
Add a second Computation node
Click on the + on our Source Module and get a new Computation node from our source data.
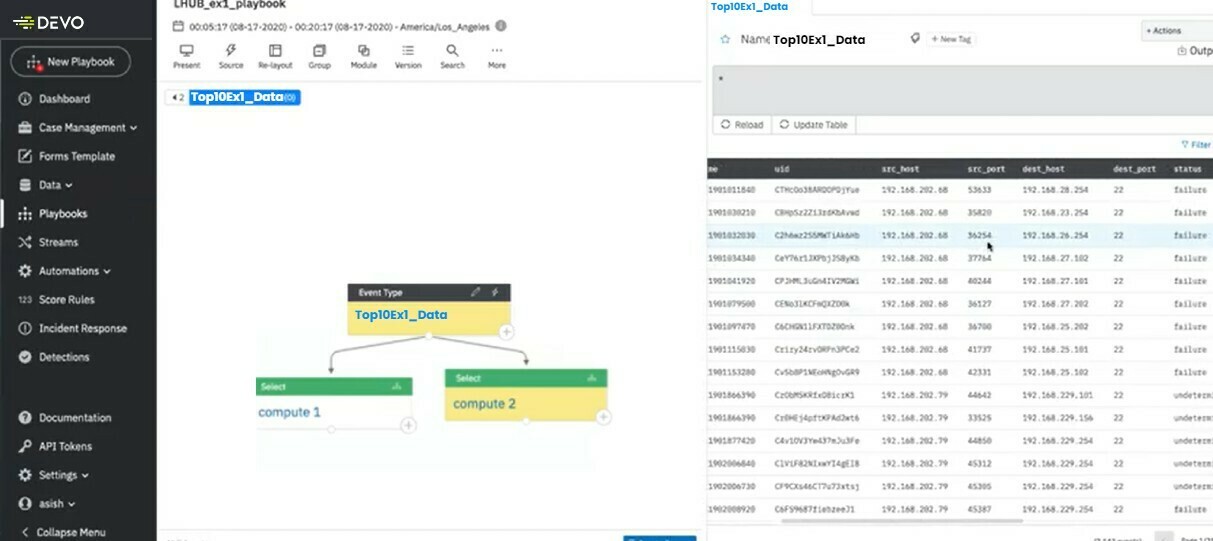
Here we will write a query to select all data with Status = failure:
'select * from Top10Ex1_Data where status="failure"'And click update table to see the results.
Add a third Computation node
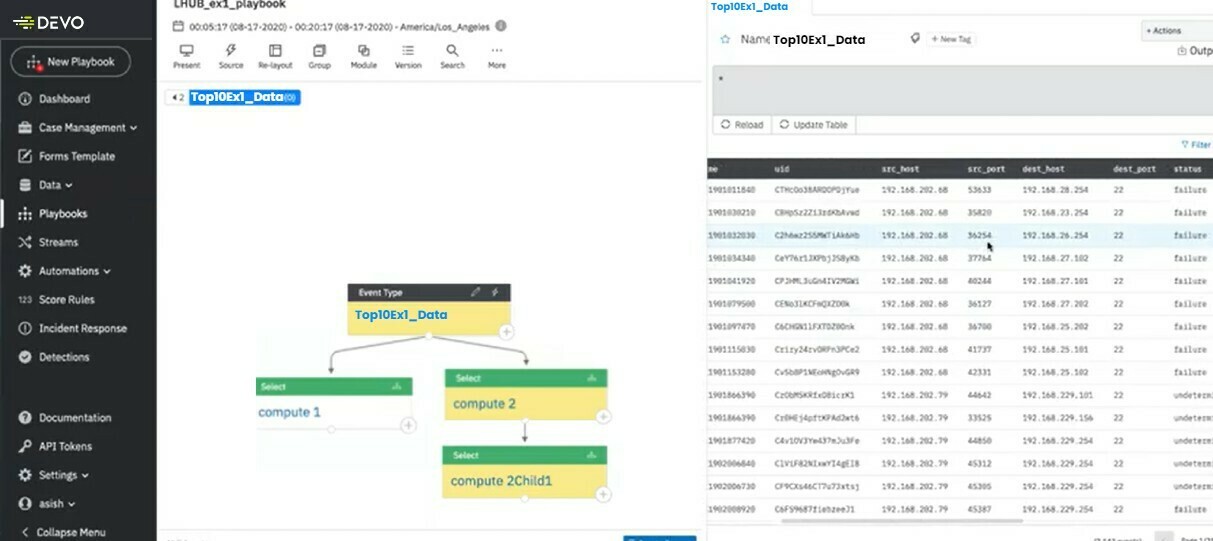
Select the new node, and rename it to compute 3. You’ll notice the select statement has changed automatically it is now:
'select * from compute_2'Pulling in the data we already filtered in compute 2 :)
We are going to evolve this into our final query.
| Code | Description |
|---|---|
| ‘select * from compute_2’ | Our starting Query |
| ‘select src_host, count(status) AS TotalFailureCount from compute_2’ | Selecting src_host, and count the status of each failure as new column TotalFailureCount |
| ‘select src_host, count(status) AS TotalFailureCount from compute_2’ group by src_host’ | grouping the results by src_host |
| ‘select src_host, count(status) AS TotalFailureCount from compute_2’ group by src_host order by TotalFailureCount’ | Sort list by TotalFailureCount |
| ‘select src_host, count(status) AS TotalFailureCount from compute_2’ group by src_host order by TotalFailureCount DESC’ | Sort list by TotalFailureCount in Descending order |
| ‘select src_host, count(status) AS TotalFailureCount from compute_2’ group by src_host order by TotalFailureCount DESC limit 10’ | Give me the top 10! |
Results:
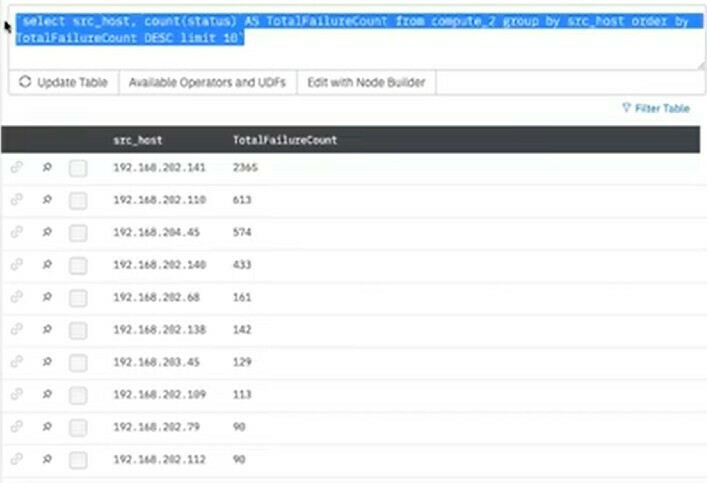
You got them! Now we can look at more advance scenarios. Stay tuned for more content here.