This post details the pre-release information for Devo Platform Release 8.8.0. This release will be pushed to production on February 1, 2024, at 11 AM UTC+1. In this release, domain Administrators will benefit from enhanced monitoring capabilities over their environment with the introduction of the Usage Analytics feature. Another item in this release is the new Conditional Formatting feature available from the Field Viewer. This will enhance the capabilities of all Data Searchers with the support of up to 5 conditional formatting conditions. Continue reading to view the full details of this update.
Release Information
- Release Date: February 1, 2024
- Release Time: 11:00am UTC+1
Geo Release
| Region | Status |
|---|---|
| CA | Released |
| US | Released |
| EU | Released |
| APAC | Released |
Table of Contents
Additional information in our Documentation is here.
New Features
Usage Analytics
Usage Analytics is a new Dashboard inside Devo designed to help Administrators understand how Devo is being used in their environment. Accessible from the Administration Menu on the top left, this new dashboard allows the administrator to monitor:
- Weekly Active Users
- Ingestion metrics
- Average daily ingestion for last 7 days
- Ingestion per technology for last 7 days
- Query count metrics
- Query count for the 3 most common ways to query data
- Data Search
- API queries
- Odata queries
- Number of queries by origin for last 7 days grouped by every 1 hour
- Query count for the 3 most common ways to query data
- Resource usage distribution
- Shows how different areas of the product consume compute resources over time
- Resource usage per component during last 24 hours
Conditional Formatting introduced to the Field Viewer
You can now add conditional formatting to your tables! You can add up to a maximum of 5 conditions that specify an operator and value, along with text and background color, to apply to the matching cells.
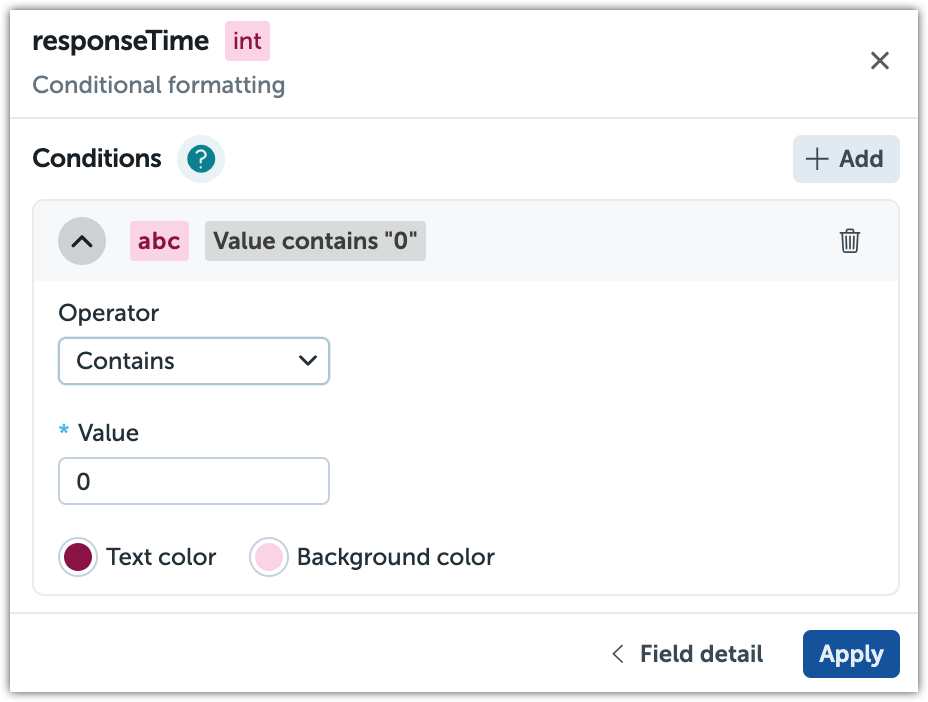
Each condition provides a preview, along with tags, that indicate the visual format and the value. To enact the changes of the preview, be sure to click on apply!
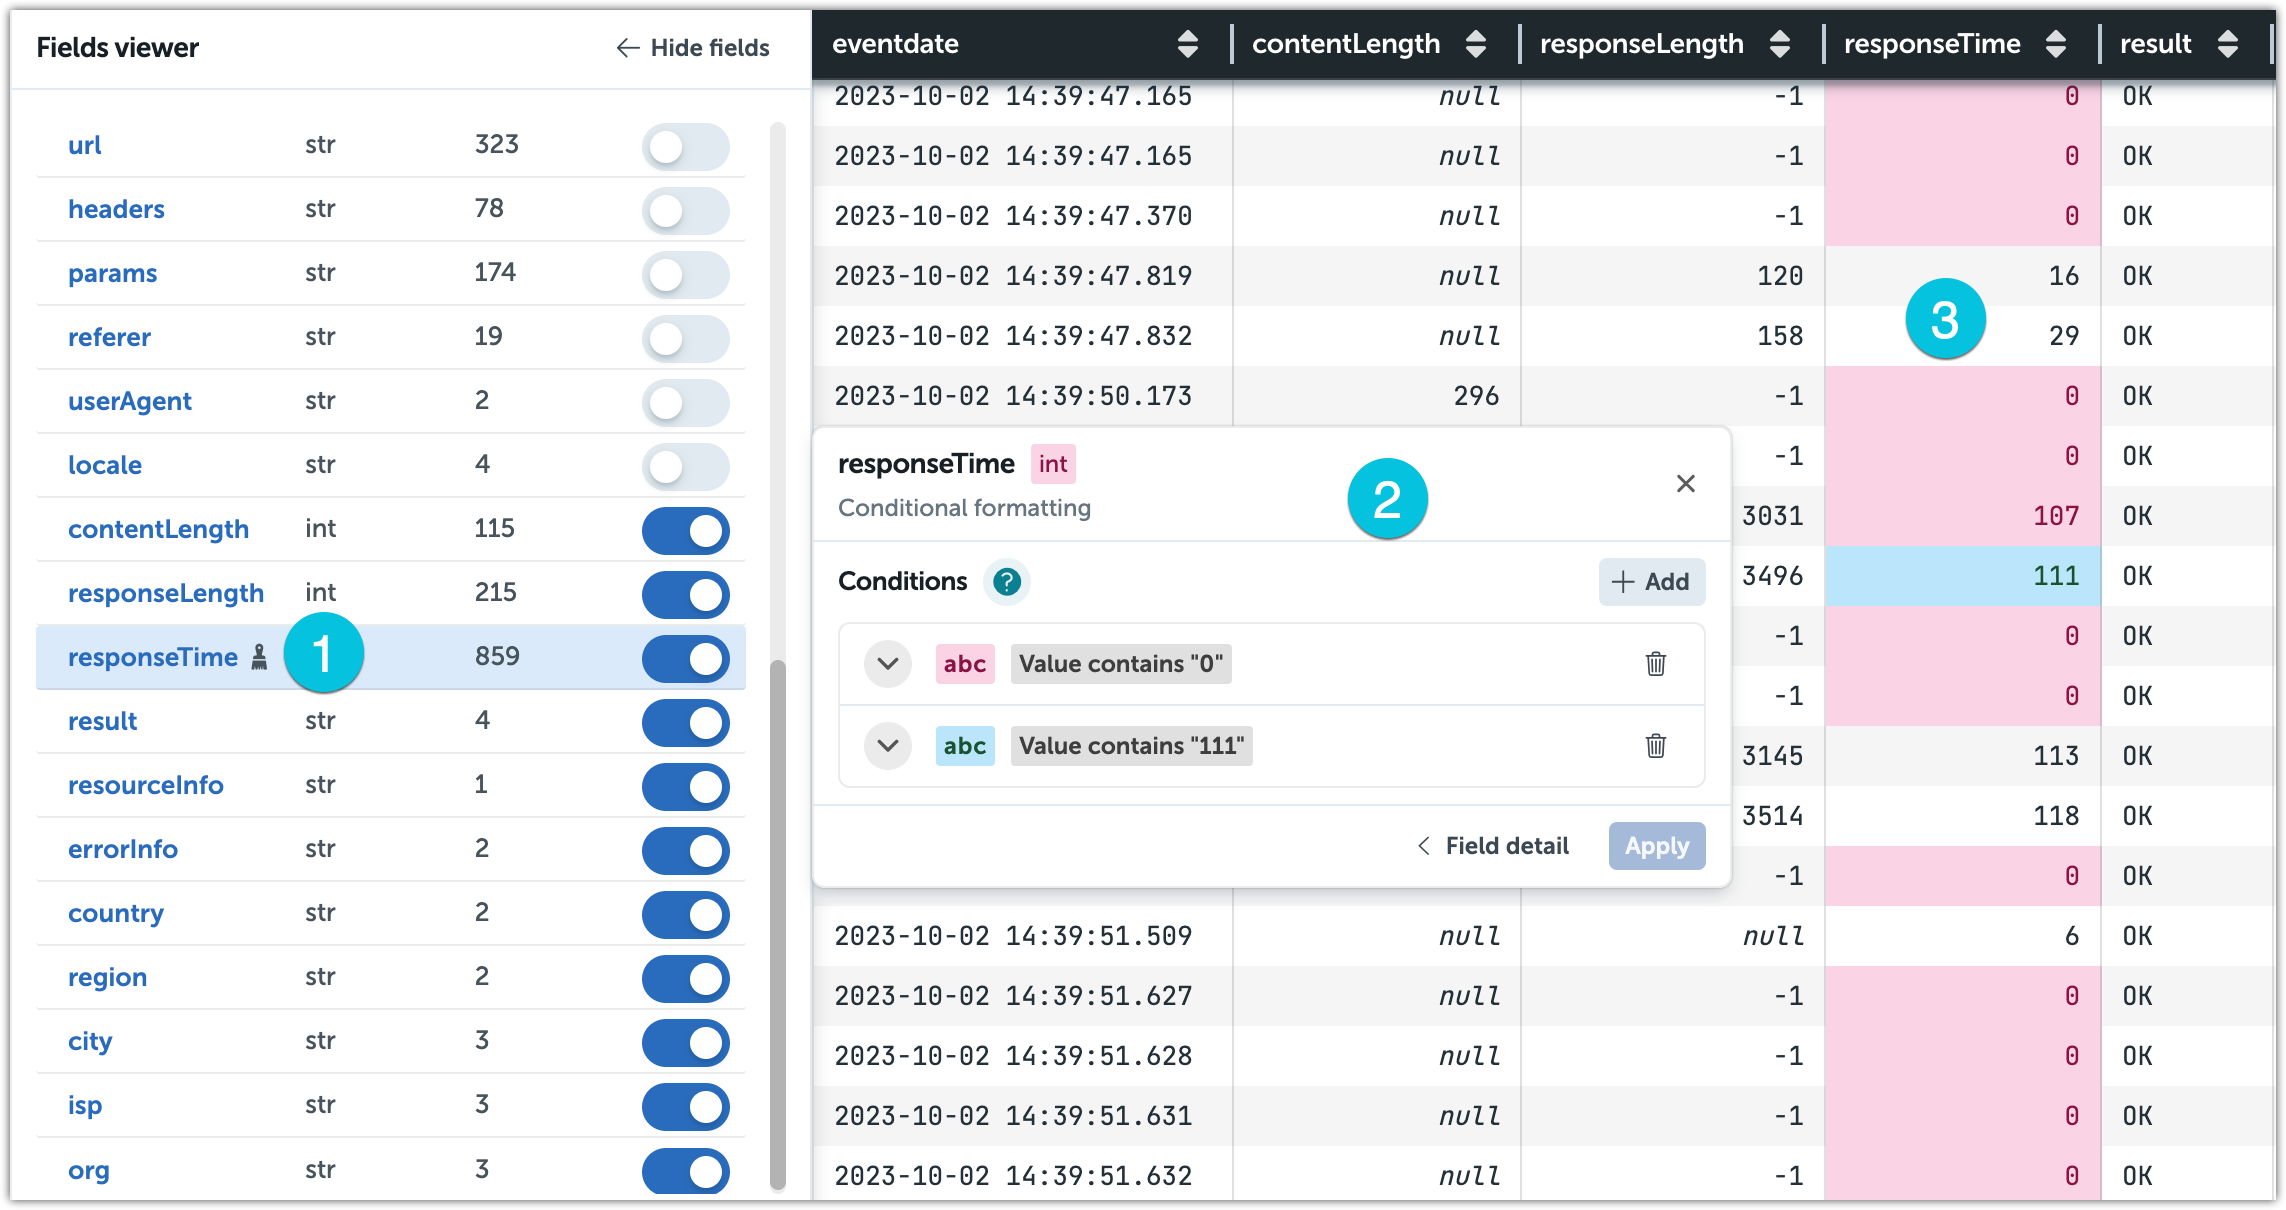
2) The conditional formatting tab open with the conditions set.
3) How it is shown in the data table.
New Alerts audit table added
A new audit table is available for Alerts called “devo.audit.alert.definition” in all domains. This audit table will log all user activities related with Alert definitions in reference to a domain. The activities logged by this new table are:
- Alert creation
- Alert edition
- Alert enable/disable
- Alert deletion
Change Alert Status in Bulk actions
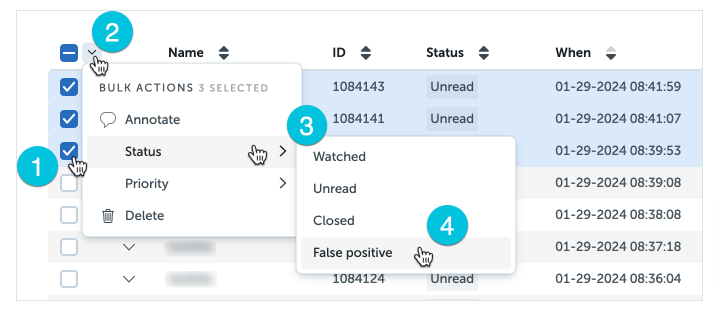
You can change the status of several alerts by checking the boxes next to the names, clicking the Bulk actions button next to the master checkbox, and selecting Status followed by the desired status.
Change Alert Priority in Bulk actions
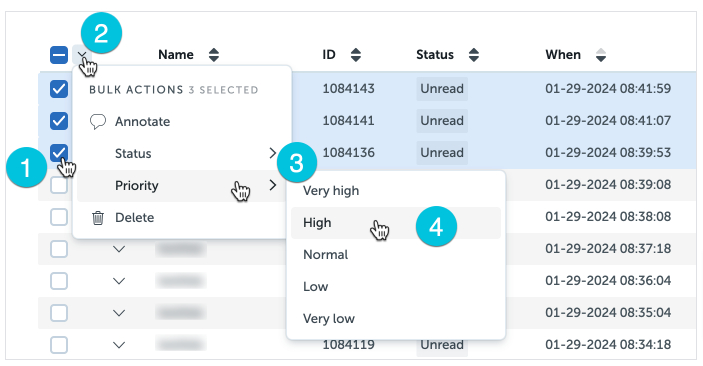
You can change the priority of several alerts by checking the boxes next to the names, clicking the Bulk actions button next to the master checkbox, and selecting Priority followed by the desired priority level.
New EACH Alert creation/editing options
When creating an Each Alert you can now select to include all fields or only those query fields explicitly called in your alert plus the eventdate field. Available only for EACH Alert with query without grouping clause.

Select Include all fields check box to include all fields in your alert.
Bug fixes (of course)

